
Hydrogen storage
Hydrogen can be transported in pipelines similar to natural gas. There are networks for hydrogen already operating today, a 1500 km network in Europe and a 720 km network in the USA. The oldest hydrogen pipe network is in the Ruhr area in Germany and has operated for more than 50 years. The tubes with a typical diameter of 25-30 cm are built using conventional pipe steel and operate at a pressure of 10 to 20 bar. The volumetric energy density of hydrogen gas is 36% of the volumetric energy density of natural gas at the same pressure. In order to transport the same amount of energy the hydrogen flux has to be 2.8 times larger than the flux of natural gas. However, the viscosity of hydrogen (8.92·10-6 Pa s) is significantly smaller than that of natural gas (11.2·10-6 Pa s). The minimum power P required to pump a gas through a pipe is given by
![]() (Eq. 1)
(Eq. 1)
where l is the length of the pipe, v the velocity and h the dynamic viscosity of the gas. The transmission power per energy unit is therefore 2.2 times larger for hydrogen as compared to natural gas. The total energy loss during the transportation of hydrogen is about 4% of the energy content. Because of the great length, and therefore the great volume of piping systems, a slight change in the operating pressure of a pipeline system results in a large change of the amount of hydrogen gas contained within the piping network. Therefore, the pipeline can be used to handle fluctuations in supply and demand, avoiding the cost of onsite storage.The ordinary isotope of hydrogen, H. is known as protium and has an atomic weight of 1 (1 proton and 1 electron). In 1932, the preparation of a stable isotope was announced, deuterium (D) with an atomic weight of 2 (1 proton and 1 neutron, 1 electron). Two years later an unstable isotope, tritium (T), with an atomic weight of 3 (1 proton and 2 neutron, 1 electron) was discovered. Tritium has a half-life time of 12.5 years [7]. Deuterium is found in 0.017% of all hydrogen isotopes. Tritium atoms are also present 10-18% as a result of natural processes in the atmosphere, as well as from fallout from past atmospheric nuclear weapons tests and the operation of nuclear reactors and fuel reprocessing plants.
The hydrogen molecule H2 can be found in various forms depending on the temperature and the pressure which are shown in the phase diagram (fig. 1). At low temperature hydrogen is a solid with a density of 70.6 kg·m-3 at -262°C and is a gas at higher temperatures with a density of 0.089886 kg·m-3 at 0°C and a pressure of 1 bar. A small zone starting at the triple point and ending at the critical point exhibits the liquid hydrogen with a density of 70.8 kg·m-3 at -253°C. At ambient temperature (298.15K) hydrogen is a gas and can be described by the Van der Waals equation:
 (Eq. 2)
where p is the gas pressure, V the volume, T the absolute temperature, n the number of mols, R the gas constant (R = 8.314 J·K-1·mol-1), a is the dipole interaction or repulsion constant (a = 2.476·10-2 m6·Pa·mol-2) and b is the volume occupied by the hydrogen molecules itself (b = 2.661·10-5 m3·mol-1) [7]. The mass of the hydrogen molecule is half of that of the He atom and therefore, the mean amplitude of the thermal oscillations is larger for H2 than for He. However, the hydrogen molecule is not perfectly spherical in contrast to the He atom. Charge fluctuations in the H2-molecule cause a more attractive Van der Waals force between H2 compared to He. This leads to a significantly higher critical temperature for hydrogen (Tc = 33.2 K) as compared to helium (Tc = 5.19 K), but still a very low Tc for H2 compared to all other gases.
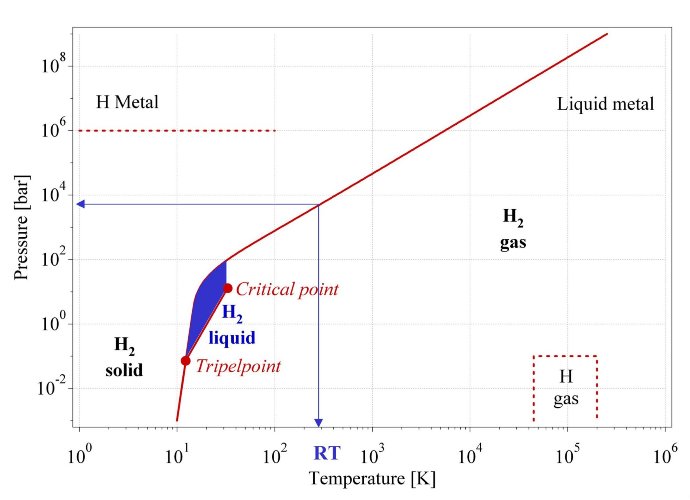
Fig. 1 Primitive phase diagram [10] for hydrogen. Liquid hydrogen only exists between the solidus line and the line from the triple point at 21.2K and the critical point at 32K.
Hydrogen storage basically implies the reduction of the enormous volume of the hydrogen gas. 1 kg of hydrogen at ambient temperature and atmospheric pressure takes a volume of 11 m3. In order to increase the hydrogen density in a storage system work must either be applied to compress hydrogen, or the temperature has to be decreased below the critical temperature or finally, the repulsion has to be reduced by the interaction of hydrogen with an other material.
The second important criteria of a hydrogen storage system is the reversibility of the hydrogen uptake and release. This criteria excludes all covalent hydrogen carbon compounds as hydrogen storage materials because the hydrogen is only released from carbon hydrogen compounds if they are heated to temperatures above 800°C or if the carbon is oxidized. There are basically six methods in order to reversibly store hydrogen with a high volumetric and gravimetric density (tab. 2). The following chapters focus on these methods and illustrates there advantages and disadvantages.
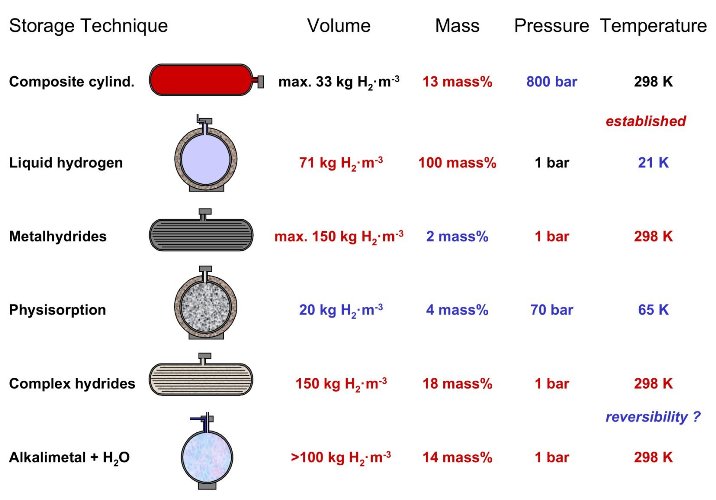
Tab. 2 The six basic hydrogen storage methods and phenomena. The gravimetric density rm, the volumetric density rv, the working temperature T and pressure p are listed. RT stands for room temperature (25°C). From top to bottom: compressed gas (molecular H2) in light weight composit cylinder (tensile strength of the material is 2000 MPa); liquid hydrogen (molecular H2), continuous loss of a few % per day of hydrogen at RT; physisorption (molecular H2) on materials e.g. carbon with a very large specific surface area, fully reversible; hydrogen (atomic H) intercallation in host metals, metallic hydrides working at RT are fully reversible; complex compounds ([AlH4]– or [BH4]–), desorption at elevated temperature, adsorption at high pressures; chemical oxidation of metals with water and liberation of hydrogen, not directly reversible?
1. High pressure gas cylinders
The most common storage system are high pressure gas cylinders with a maximum pressure of 20 MPa. New light weight composite cylinders have been developed which are able to withstand a pressure up to 80 MPa and so the hydrogen can reach a volumetric density of 36 kg·m-3, approximately half as much as in its liquid form at the normal boiling point. The gravimetric hydrogen density decreases with increasing pressure due to the increasing thickness of the walls of the pressure cylinder. The wall thickness of a cylinder capped with two hemispheres is given by the following equation:
![]() (Eq. 3)
(Eq. 3)
where dw is the wall thickness, do the outer diameter of the cylinder, Dp the overpressure and sV the tensile strength of the material. The tensile strength of materials varies from 50 MPa for aluminum to more than 1100 MPa for high quality steel. Future, developments of new composite materials have a potential to increase the tensile strength above that of steel with a materials density which is less than half of the density of steel.

Fig. 2 Volumetric density of compressed hydrogen gas as a function of gas pressure including the ideal gas and liquid hydrogen. The ratio of the wall thickness to the outer diameter of the pressure cylinder is shown on the right hand side for steel wit a tensile strength of 460 MPa. A schematic drawing of the pressure cylinder is shown as an inset.
High quality pressure cylinders today are made of austenitic stainless steel (e.g. AISI 316 and 304 and AISI 316L and 304L above 300°C to avoid carbon grain-boundary segregation), copper, or aluminum alloys which are largely immune to hydrogen effects at ambient temperatures. Many other materials are subject to embrittlement and should not be used e.g. alloy or high strength steels (ferritic, martensitic, and bainitic), titanium and its alloys and some nickel based alloys. Figure 7 shows the volumetric density of hydrogen inside the cylinder and the ratio of the wall thickness to the outer diameter of the pressure cylinder for stainless steel with a tensile strength of 460 MPa. The volumetric density of hydrogen increases with pressure and reaches a maximum above 1000 bar, depending on the tensile strength of the material. However, the gravimetric density decreases with increasing pressure and the maximum gravimetric density is found for zero overpressure! Therefore, the increase in volumetric storage density is sacrificed with the reduction of the gravimetric density in pressurized gas systems.
The safety of pressurized cylinders is an issue of concern especially in highly populated regions. Future pressure vessels are envisaged to consist of three layers: an inner polymer liner, over-wrapped with a carbon-fiber composite (which is the stress-bearing component) and an outer layer of an aramid-material capable of withstanding mechanical and corrosion damage. The target that the industry has set for itself is a 70 MPa cylinder with a mass of 110 kg resulting in a gravimetric storage density of 6mass% and a volumetric storage density of 30 kg·m-3.
Hydrogen can be compressed using standard piston-type mechanical compressors. Slight modifications of the seals are sometimes necessary in order to compensate for the higher diffusivity of hydrogen. The theoretical work necessary for the isothermal compression of hydrogen is given by the following equation:
![]() (Eq. 4)
(Eq. 4)
Hydrogen can be compressed using standard piston-type mechanical compressors. Slight modifications of the seals are sometimes necessary in order to compensate for the higher diffusivity of hydrogen. The theoretical work necessary for the isothermal compression of hydrogen is given by the following equation:
The relatively low hydrogen density together with the very high gas pressures in the systems are important drawbacks of the technically simple and, on the laboratory scale, well established high pressure storage method.
2. Liquid hydrogen
Liquid hydrogen is stored in cryogenic tanks at 21.2 K at ambient pressure. Due to the low critical temperature of hydrogen (33K) liquid hydrogen can only be stored in open systems, because there is no liquid phase existent above the critical temperature. The pressure in a closed storage system at room temperature could increase to about 104 bar. The volumetric density of liquid hydrogen is 70.8 kg·m-3 and slightly higher than that of solid hydrogen (70.6 kg·m-3). The challenges of liquid hydrogen storage are the energy efficient liquefaction process and the thermal insulation of the cryogenic storage vessel in order to reduce the boil-off of hydrogen.
The hydrogen molecule is composed of two protons and two electrons. The combination of the two electron spins only leads to a binding state if the electron spins are anti parallel. The wave function of the molecule has to be anti symmetric in view of the exchange of the space coordinates of two fermions (spin = 1/2). Therefore, two groups of hydrogen molecules exist according to the total nuclear spin (I = 0, antiparallel nuclear spin and I = 1, parallel nuclear spin). The first group with I = 0 is called para-hydrogen and the second group with I = 1 is called ortho-hydrogen. Normal hydrogen at room temperature contains 25% of the para form and 75% of the ortho form. The ortho form cannot be prepared in the pure state. Since the two forms differ in energy, the physical properties also differ. The melting and boiling points of para hydrogen are about 0.1 K lower than those of normal hydrogen. At zero Kelvin, all the molecules must be in a rotational ground state i.e. in the para form.
When hydrogen is cooled from room temperature (RT) to the normal boiling point (nbp = 21.2K) the ortho hydrogen converts from an equilibrium concentration of 75% at RT to 50% at 77K and 0.2% at nbp. The self conversion rate is an activated process and very slow, the half-life time of the conversion is greater than one year at 77K. The conversion reaction from ortho- to para-hydrogen is exothermic and the heat of conversion is also temperature dependent. At 300K the heat of conversion is 270 kJ·kg-1 and increases as the temperature decreases, where it reaches 519 kJ·kg-1 at 77K. At temperatures lower than 77K the enthalpy of conversion is 523 kJ·kg-1 and almost constant. The enthalpy of conversion is greater than the latent heat of vaporization (HV = 451.9 kJ·kg-1) of normal and para hydrogen at the nbp. If the unconverted normal hydrogen is placed in a storage vessel, the enthalpy of conversion will be released in the vessel, which leads to the evaporation of the liquid hydrogen. The transformation from ortho- to para-hydrogen can be catalyzed by a number of surface active and paramagnetic species, e.g. normal hydrogen can be adsorbed on charcoal cooled with liquid hydrogen and desorbed in the equilibrium mixture. The conversion may take only a few minutes if a highly active form of charcoal is used. Other suitable ortho-para catalysts are metal such as tungsten, nickel, or any paramagnetic oxides like chromium or gadolinium oxides. The nuclear spin is reversed without breaking the H-H bond.
The simplest liquifaction cycle is the Joule-Thompson cycle (Linde cycle, fig. 8). The gas is first compressed, and then cooled in a heat exchanger, before it passes through a throttle valve where it undergoes an isenthalpic Joule-Thomson expansion, producing some liquid. The cooled gas is separated from the liquid and returned to the compressor via the heat exchanger [12]. The Joule-Thompson cycle works for gases, such as nitrogen, with a inversion temperature above room temperature. Hydrogen, however, warms upon expansion at room temperature. In order for hydrogen to cool upon expansion, its temperature must be below its inversion temperature of 202K. Therefore, hydrogen is usually pre-cooled using liquid nitrogen (78K) before the first expansion step occurs. The free enthalpy change between gaseous hydrogen at 300K and liquid hydrogen at 20K is 11640 kJ·kg-1 [13]. The necessary theoretical energy (work) to liquify hydrogen from RT is Wth = 3.23 kWh·kg-1, the technical work is about 15.2 kWh·kg-1 [14] almost half of the lower heating value of the hydrogen combustion.
The boil-off rate of hydrogen from a liquid hydrogen storage vessel due to heat leaks is a function of the size, the shape and the thermal insulation of the vessel. Theoretically the best shape is a sphere since it has the least surface to volume ratio and because stress and strain are distributed uniformly. However, large size, spherical containers are expensive because of their manufacturing difficulty. Since boil off losses due to heat leaks are proportional to the surface to volume ratio, the evaporation rate diminishes drastically as the storage tank size increases. For double-walled vacuum-insulated spherical dewars, boil-off losses are typically 0.4% per day for tanks which have a storage volume of 50 m3, 0.2% for 100m3 tanks, and 0.06% for 20000m3 tanks. Low temperature para-hydrogen requires the use of materials which retain good ductility at low temperatures. Austenitic stainless steel (e.g. AISI 316L and 304L) or aluminum and aluminum alloys (Serie 5000) are recommended. Polytetrafluorethylene (PTFE, Teflon®) and 2-Chloro-1,1,2-trifluoroethylene (Kel-F®) can also be used.
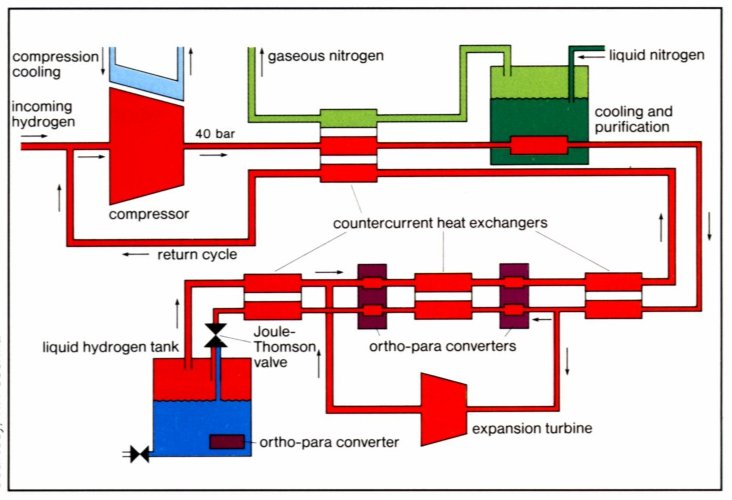
Fig. 3 The Joule-Thompson cycle (Linde cycle). The gas is first compressed, and then cooled in a heat exchanger, before it passes through a throttle valve where it undergoes an isenthalpic Joule-Thomson expansion, producing some liquid. The cooled gas is separated from the liquid and returned to the compressor via the heat exchanger
The relatively large amount of necessary energy for the liquefaction and the continuous boil-off of hydrogen limit the possible applications for liquid hydrogen storage systems to utilization’s where the cost of hydrogen is not an important issue and the hydrogen is consumed in a rather short time, e.g. air and space applications.
3. Physisorption of hydrogen
The adsorption of a gas on a surface is a consequence of the field force at the surface of the solid, called the adsorbent, which attracts the molecules of the gas or vapor, called adsorbate. The origin of the physisorption of gas molecules on the surface of a solid are resonant fluctuations of the charge distributions and are therefore called dispersive interactions or Van der Waals interactions. In the physisorption process a gas molecule interacts with several atoms at the surface of the solid. The interaction is composed of two terms: an attractive term which diminishes with the distance between the molecule and the surface to the power of -6 and a repulsive term which diminishes with the distance to the power of –12. Therefore, the potential energy of the molecule shows a minimum at a distance of approximately one molecular radius of the adsorbate. The energy minimum is of the order of 0.01 to 0.1 eV (1 to 10 kJ·mol-1) [15]. Due to the weak interaction, a significant physisorption is only observed at low temperatures (< 273 K). Once a monolayer of adsorbate molecules is formed the gaseous molecule interact with a surface of the liquid or solid adsorbate. Therefore, the binding energy of the second layer of adsorbate molecules is similar to the latent heat of sublimation or vaporization of the adsorbate. Consequently, the adsorption of the adsorbate at a temperature equal or greater to the boiling point at a given pressure leads to the adsorption of one single monolayer [16]. In order to estimate the quantity of adsorbate in the monolayer the density of the liquid adsorbate and the volume of the molecule must be used. If the liquid is assumed to consist of a closed packed fcc structure, the minimum surface area Sml for one mol of adsorbate in a monolayer on a substrate can be calculated from the density of the liqud rliq and the molecular mass of the adsorbate Mads.
 (Eq. 5)
NA stands for the Avogadro constant (NA = 6.022·1023 mol-1). The monolayer surface area for hydrogen is Sml(H2) = 85917 m2·mol-1. The amount of adsorbate mads on a substrate material with a specific surface area Sspec is then given by mads = Mads·Sspec/Sml. In the case of carbon as the substrate and hydrogen as the adsorbate, the maximum specific surface area of carbon is Sspec = 1315 m2·g-1 (single side graphene sheet) and the maximum amount of adsorbed hydrogen is mads = 3.0 mass%. From this theoretical approximation we may conclude that the amount of adsorbed hydrogen is proportional to the specific surface area of the adsorbent with mads/Sspec = 2.27·10-3 mass%·m-2 g and can only be observed at very low temperatures.
Much work on reversible hydrogen sorption of carbon nanostructures was stimulated by findings published in an article from A.C. Dillon et al. [17]. This paper describes the results of a brief hydrogen desorption experiment. The authors estimated the hydrogen storage capacity of carbon nanotubes at that time to be 5 to 10 mass%. The investigation was carried out on a carbon sample containing an estimated (TEM micrographs) amount of 0.1 to 0.2 mass% of single wall carbon nanotubes. The amount of hydrogen desorbed in the high-temperature peak, which is roughly 5 to 10 times smaller than the low temperature physisorption peak, was 0.01 mass%. The authors concluded „Thus the gravimetric storage density per SWNT ranges from 5 to 10 mass%“. Three years later in a report to the DOE [18] this peak has moved significantly by 300 K up to 600 K. Apparently the reported results are inconsistent. Hirscher et al. [19] clarified the situation and showed that desorption of the hydrogen originates from Ti-alloy particles in the sample, introduced during the ultrasonic treatment, rather than from the carbon nanotubes.
The main difference between carbon nanotubes and high surface area graphite is the curvature of the graphene sheets and the cavity inside the tube. In microporous solids with capillaries which have a width not exceeding a few molecular diameters, the potential fields from opposite walls will overlap so that the attractive force which act up on adsorbate molecules will be increased as compared with that on a flat carbon surface [20]. This phenomenon is the main motivation for the investigation of the hydrogen interaction with carbon nanotubes.
Most papers reporting theoretical studies on hydrogen absorption in carbon nanostructures focus on the physisorption of H2 on carbon using the grand canonical Monte Carlo simulation. Stan and Cole [21] used the Feynman (semiclassical) effective potential approximation to calculate the adsorption potential and the amount of hydrogen adsorbed on a zigzag nanotube (13,0) with a diameter of 1.018nm. The adsorption potential was found to be 9 kJ mol-1 (0.093 eV) for hydrogen molecules inside the nanotubes at 50 K, the potential is about 25% higher as compared to the flat surface of graphite due to the curvature of the surface. Therefore an increased number of carbon atoms interacts with the hydrogen molecule. The ratio of hydrogen adsorbed in the tube to that on a flat surface decreases strongly with increasing temperature and is 10000 at 50 K and 100 at 77 K (values taken from figure). Rzepka et al. [22] used a grand canonical ensemble Monte Carlo program to calculate the amount of absorbed hydrogen for a slit pore and a tubular geometry. The amount of absorbed hydrogen depends on the surface area of the sample, the maximum is at 0.6 mass% (p = 6 MPa, T = 300 K). The calculation was experimentally verified with excellent agreement. At a temperature of 77 K the amount of absorbed hydrogen is about one order of magnitude higher compared to 300 K. Williams and Eklund [23] performed grand canonical Monte Carlo simulation of H2 physisorption in finite-diameter carbon SWNT ropes and found an increasing amount of adsorbed hydrogen with decreasing temperature from 1.4 mass% (p = 10 MPa, T = 300 K) to 9.6 mass% (p = 10 MPa, T = 77 K). For lower hydrogen pressure this range is shifted to considerably lower amounts of adsorbed hydrogen, i.e. 0.2 mass% (p = 1 MPa, T = 300 K) to 5.9 mass% (p = 10 MPa, T = 77 K). Lee et al. [24] have performed density-functional and density-functional-based tight binding calculations to search for hydrogen chemisorption sites on single wall-nanotubes. The investigation of the absorption of the hydrogen inside the tubes has shown that it is energetically more favorable for the hydrogen atoms to recombine and form molecules, which are then physisorbed inside the nanotube. Ma et al. [25] performed a molecular dynamics simulation for H implantation. The hydrogen atoms (20 eV) were implanted through the side walls of a single wall carbon nanotube (5,5) consisting of 150 atoms and have a diameter of 0.683 nm. They found that the hydrogen atoms recombine to molecules inside the tube and arrange themselves to a concentric tube. The hydrogen pressure inside the SWNT increases as the number of injected atoms increases and reaches 35 GPa for 90 atoms (5mass%). This simulation does not exhibit a condensation of hydrogen inside the nanotube. The critical temperature of hydrogen (H2) is 33.25K [26]. Therefore, at temperatures above 33.25 K and at all pressures, hydrogen does not exist as a liquid phase, hydrogen is either a gas or a solid. The density of liquid and solid hydrogen at the melting point (Tm = 14.1 K) is 70.8 kg m-3 and 70.6 kg m-3, respectively. The measurement of the latent heat of condensation of nitrogen on carbon black [27] showed, that the heat for the adsorption of one monolayer is between 11 to 12 kJ·mol-1 (0.11 to 0.12 eV) and drops for subsequent layers to the latent heat of condensation for nitrogen which is 5.56 kJ·mol-1 (0.058 eV). If we assume, that hydrogen behaves in a similar manner to nitrogen, then hydrogen would only form one monolayer of liquid at the surface of carbon at temperatures above the boiling point. Geometrical considerations of the nanotubes lead to the specific surface area and therefore, to the maximum amount of condensed hydrogen in a surface monolayer. Figure 9 shows the maximum amount of hydrogen in mass% for the physisorption of hydrogen on carbon nanotubes [28]. The maximum amount of adsorbed hydrogen is 2.0 mass% for single wall carbon nanotubes (SWNT) with a specific surface area of 1315 m2 g-1 at a temperature of 77 K.
Experiments on hydrogen adsorption in carbon nanostructures were carried out with different methods under various conditions and on plenty of small and often not very well characterized samples. Hydrogen gas adsorption isotherms (T = 80 K) were performed by Ye et al. on purified SWNT samples [29]. The BET surface area of the SWNT sample was found to be 285 m2·g-1 and remained unchanged upon the hydrogen absorption and desorption. The hydrogen adsorption obtained at a temperature of 80 K and a pressure of 0.32 MPa was H/C = 0.04 for the SWNT sample and was H/C = 0.28 for the high surface area saran-carbon ( 1600 m2·g-1). At high hydrogen pressures (7 MPa) at a temperature of 80 K, the hydrogen to carbon ratio for the SWNT sample reached H/C = 1 (7.7 mass%) in the initial absorption. In the following absorption cycles the absorption isotherm shifted considerably to higher pressure. The hydrogen to carbon ratio of H/C = 0.8 was reached at 12 MPa. Liu et al. [30] applied high pressure (12 MPa) hydrogen gas at room temperature (298 K) to SWNT and followed the pressure change with time. The samples equilibrated after approximately 300 minutes and reached a maximum absorption of 4.2 mass% (H/C = 0.5). About 20% of the absorbed hydrogen remained in the sample after desorption at room temperature. Fan et al. [31] investigated the hydrogen absorption of vapor-grown carbon nanofibers with a diameter of 5 nm to 300 nm. The fibers absorbed hydrogen up to 12.38 mass% when a hydrogen pressure of 12 MPa was applied. The absorption equilibrated after 200 – 300 minutes. Chen et al [32] reported that a high hydrogen uptake of 14 mass% to 20 mass% can be achieved for K- and Li-doped MWNT, respectively, at a pressure of 0.1 MPa. The K-doped MWNT absorb hydrogen at room temperature, but they are chemically unstable, whereas the Li-doped MWNT are chemically stable, but require elevated temperatures (473 – 673 K) for maximum absorption and desorption of hydrogen. However, the increase of the mass observed upon hydrogen absorption was due to impurities like oxygen and water and therefore due to the oxidation of the alkali metals [33] rather than a hydrogen uptake. A large variety of carbon samples was investigated by Ströbel et al. [34], using a high-pressure microbalance. The BET (N2) surface area of the samples ranges from 100 m2·g-1 up to 3300 m2·g-1. The absorbed amount of hydrogen (p = 12.5 MPa, T = 296 K) correlates with the surface area according to the equation x [mass%] = 0.0005·S[m2·g-1] (taken from figure) except for the nano fiber samples. The latter exhibit a rather low surface area of approximately 100 m2·g-1; however, the increase in mass upon hydrogen absorption corresponds to about 1.2 mass%. The measured adsorption isotherms approximately follow the Langmuir adsorption model. Some isotherms intercept the mass-axis (p = 0) at x = 0, other intercept at a finite mass between 0.2 and 0.4 mass%. Nijkamp et al. [35] characterised a large number of carbonaceous sorbents using N2 physisorption at 77 K and up to a pressure of 1 bar. The sorbents were chosen to represent a large variation in surface areas and (micropores) volumes. Both non-porous materials, such as aerosil and graphites, and microporous sorbents, such as activated carbons and zeolites, were selected.
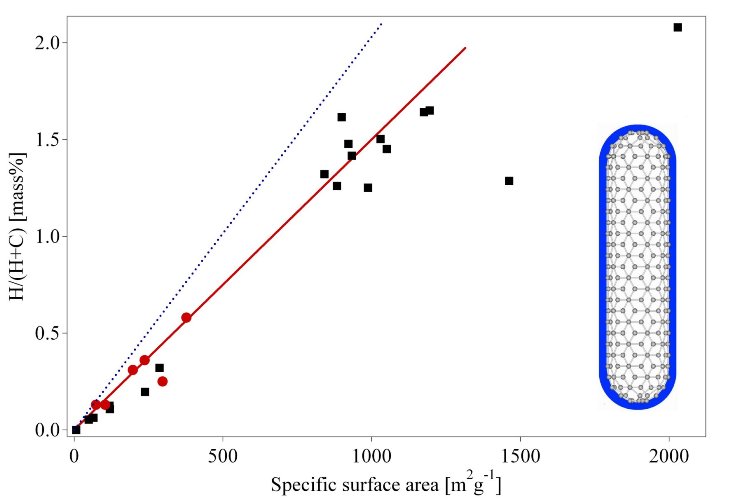
Fig. 4 Reversible amount of hydrogen (electrochemical measurement at 298 K) versus the B.E.T. surface area (round markers) of a few carbon nanotube samples including two measurements on high surface area graphite (HSAG) samples together with the fitted line. Hydrogen gas adsorption measurements at 77 K from Nijkamp et al. [35] (squere markers) are included. The dotted line represents the calculated amount of hydrogen in a monolayer at the surface of the substrate.
The H2-adsorption measurements were performed at 77 K in the pressure range 0 – 1 bar. From adsorption–desorption experiments it is evident that reversible physisorption takes place exclusively with all samples. The amount of adsorbed hydrogen correlates with the specific surface area of the sample (fig. 9). A few papers on electrochemical measurements at room temperature of hydrogen uptake and release have been published [36-39]. The electrochemical hydrogen absorption is reversible. The maximum discharge capacity measured at 298 K is 2 mass% with a very small discharge current (discharge process for 1000h).
It is remarkable, that the measurements of the hydrogen uptake in the gas phase at 77 K exhibit the same quantities as the electrochemical measurements at room temperature 298 K. In the electrochemical charging process hydrogen atoms are left back at the surface of the electrode when the electron transfer from the conductor to the water molecules takes place. The hydrogen atoms recombine to hydrogen molecules. This process goes on until the surface is completely covered with a monolayer of physisorbed H2 molecules. Additional hydrogen does not interact with the attractive Van der Waals forces of the surface. The hydrogen molecules become very mobile and form gas bubbles, which are released from the electrode surface. The formation of a stable monolayer of hydrogen at the electrode surface at room temperature is only possible if either the hydrogen atoms or the hydrogen molecules are immobile, i.e. their surface diffusion has to be kineticly hindered by a large energy barrier probably due to the adsorbed electrolyte (H2O) molecules in the second layer. An other possible reaction path was first reported [24] as a result of density-functional calculation. The result of this calculation is that hydrogen atoms tend to chemisorb at the exterior surface of a nanotube. The atoms can then flip in and recombine to hydrogen molecules finally at high coverage forming a concentric cylinder in the cavity of the nanotube. If the binding energy of the chemisorbed hydrogen is relatively low compared to the energy in hydrocarbons, the absorbed amount of hydrogen is proportional to the surface area of the carbon sample and could also desorb at rather positive electrochemical potential.
In conclusion: the reversible hydrogen sorption process on carbon nanostructures is based on the physisorption. The amount of adsorbed hydrogen is proportional to the BET surface area of the nanostructured carbon sample. The amount of adsorbed hydrogen from the gas phase at 77 K and electrochemically at room temperature is 1.5·10-3 mass%·m-2 g. Together with the maximum specific surface area of carbon (1315 m2 g-1) the maximum absorption capacity of carbon nanostructures is 2 mass%. The experimental results are in good agreement with the theoretical estimations if we take into account that the measurements were carried out at a temperature of 77 K which is still far above the critical temperature of hydrogen of 32 K and therefore the monolayer of hydrogen is not complete at 77K. No evidence of an influence of the geometric structure of the nanostructured carbon on the amount of absorbed hydrogen was found. It’s quite obvious, that the curvature of nanotubes may only influence the adsorption energy but not the amount of adsorbed hydrogen. Furthermore, all attempts to open the nanotubes and to absorb hydrogen inside the tubes did not show an increased absorption of hydrogen molecules. Theoretical studies beyond the well-known physisorption lead to a large set of various maximum hydrogen absorption capacities. Most of the results were found under special conditions, e.g. at 0 K or high energy hydrogen atom implantation. No evidence was found for a higher density of hydrogen in and on carbon nanostructures compared to liquid hydrogen at ambient conditions.
Beside the carbon nanostructures, other nanoporeous materials have been investigated for hydrogen absorption. The hydrogen absorption of zeolites of different pore architecture and composition, e.g. A, X, Y, was analyzed in the temperature range from 293K to 573K and pressure range from 2.5 MPa to 10 MPa [40]. Hydrogen was absorbed at the desired temperature and pressure. The sample was then cooled to room temperature and evacuated. Subsequently the hydrogen release upon heating of the sample to the absorption temperature was detected. The absorbed amount of hydrogen increased with increasing temperature and increasing absorption pressure. The maximum amount of desorbed hydrogen was found to be 0.08 mass% for a sample loaded at a temperature of 573K and a pressure of 10 MPa [40]. The adsorption behavior indicates that the absorption is due to a chemical reaction rather than physisorption. At liquid nitrogen temperature (77 K) the zeolites physisorb hydrogen proportional to the specific surface area of the material. A maximum of 1.8 mass% of adsorbed hydrogen was found for a zeolite (NaY) with a specific surface area of 725 m2·g-1 [41]. The low temperature physisorption (type I isotherme) of hydrogen in zeolites is in good agreement with the adsorption model mentioned above for nanostructured carbon. The desorption isothertm followed the same path as the adsorption [41] which indicates that no pore condensation occurred. Recently a microporous metal-organic framework of the composition Zn4O(1,4-benzenedicarboxylate)3 was proposed as hydrogen storage material [42]. The material absorbes hydrogen at a temperature of 298 K proportional to the applied pressure. The slope of the linear relationship between the gravimetric hydrogen density and the hydrogen pressure was found to be 0.05 mass%·bar-1. No saturation of the hydrogen absorption was found, which is very unlikely for any kind of a hydrogen absorption process. At 77 K the amount of adsorbed hydrogen was detected to be 3.7 mass% already at very low hydrogen pressure and a slight almost linear increase with increasing pressure. This behavior is not a type I isotherm as the authors claimed and the results should be taken with care.
The big advantages of the physisorption for hydrogen storage are the low operating pressure, the relatively low cost of the materials involved and the simple design of the storage system. The rather small amount of adsorbed hydrogen on carbon together with the low temperatures necessary are significant drawbacks of the hydrogen storage based on physisorption.
4. Metal hydrides
Many metals, intermetallic compounds and alloys react with hydrogen and form mainly solid metal-hydrogen compounds. Hydrides exist as ionic, polymeric covalent, volatile covalent and metallic hydrides. The demarcation between the various types of hydrides is not sharp, they merge into each other according to the electronegativities of the elements concerned. This chapter focuses on metallic hydrides, i.e. metals and intermetallic compounds which form together with hydrogen metallic hydrides. Hydrogen reacts at elevated temperature with many transition metals and their alloys to form hydrides.
The electropositive elements are the most reactive, i.e., scandium, yttrium, the lanthanides, the actinides, and the members of the titanium and vanadium groups. The binary hydrides of the transition metals are predominantly metallic in character and are usually referred to as metallic hydrides. They are good conductors of electricity, possess a metallic or graphite-like appearance, and can often be wetted by mercury i.e. have a high surface energy.
Many of these compounds (MHn) show large deviations from ideal stoichiometry (n = 1, 2, 3) and can exist as multi-phase systems. The lattice structure is that of a typical metal with atoms of hydrogen on the interstitial sites; for this reason they are also called interstitial hydrides. This type of structure has the limiting compositions MH, MH2, and MH3; the hydrogen atoms fit into octahedral or tetrahedral holes in the metal lattice, or a combination of the two types eg. REH2 and REH3. The hydrogen carries a partial negative charge, depending on the metal an exception is, for example, PdH0.7 [43].
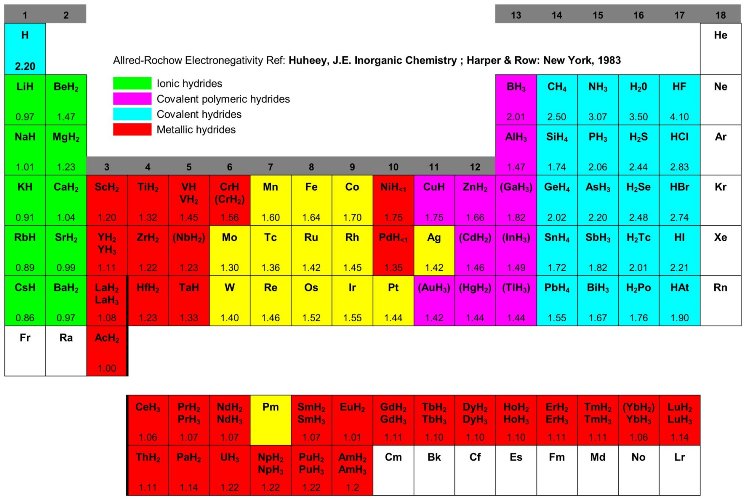
Fig. 5 Table of the binary hydrides [46] and the Allred-Rochow electronegativity [44]. Most elements react with hydrogen to form ionic, covalent or metallic binary hydrides.
Only a small number of the transition metals are without known stable hydrides. A considerable „hydride gap“ exists in the periodic table, beginning at group 6 (Cr) up to group 11 (Cu), in which the only hydrides are palladium hydride (PdH0.7), the very unstable nickel hydride (NiH<1), and the poorly defined hydrides of chromium (CrH, CrH2) and copper (CuH). In palladium hydride, the hydrogen has high mobility and probably a very low charge density. In the finely divided state, platinum and ruthenium are able to adsorb considerable quantities of hydrogen, which thereby becomes activated. These two elements, together with palladium and nickel, are extremely good hydrogenation catalysts, although they do not form hydrides [45]. Especially interesting are the metallic hydrides of intermetallic compounds, in the simplest case the ternary system ABxHn, because the variation of the elements allows to tailor the properties of the hydrides (Tab. 3).
The A element is usually a rare earth or an alkaline earth metal and tends to form a stable hydride. The B element is often a transition metal and forms only unstable hydrides. Some well defined ratios of B to A in the intermetallic compound x = 0.5, 1, 2, 5 have been found to form hydrides with a hydrogen to metal ratio of up to two.
| Intermetallic comp. | Prototype | Hydrides | Structure |
|---|---|---|---|
| AB5 | LaNi5 | LaNiH6 | Haucke phases, hexagonal |
| AB2 | ZrV2, ZrMn2, TiMn2 | ZrV2H5.5 | Laves phases, hexagonal or cubic |
| AB3 | CeNi3, YFe23 | CeNi3H4 | hexagonal, PuNi3-typ |
| A2B7 | Y2Ni7, Th2Fe7 | Y2Ni7H3 | hexagonal, Ce2Ni7-typ |
| A6B23 | Y6Fe23 | Ho6Fe23H12 | cubic, Th6Mn23-typ |
| AB | TiFe, ZrNi | TiFeH2 | cubic, CsCl- or Crb-typ |
| A2B | Mg2Ni, Ti2Ni | Mg2NiH4 | cubic, MoSi2– or Ti2Ni-typ |
Tab. 3 The most important families of hydride forming intermetallic compounds including the prototype and the structure. A is an element with a high affinity to hydrogen, and B is an element with a low affinity to hydrogen [46].
The reaction of hydrogen gas with a metal is called the absorption process and can be dscribed in terms of a simplified one-dimensional potential energy curve (one-dimensional Lennard-Jones potential, fig. 11) [47]. Far from the metal surface the potential of a hydrogen molecule and of 2 hydrogen atoms are separated by the dissociation energy (H2 -> 2H, ED = 435.99 kJ·mol-1). The first attractive interaction of the hydrogen molecule approaching the metal surface is the Van der Waals force leading to the physisorbed state (EPhys » 10 kJ·mol-1) approximately one hydrogen molecule radius (» 0.2 nm) from the metal surface. Closer to the surface the hydrogen has to overcome an activation barrier for dissociation and formation of the hydrogen metal bond. The height of the activation barrier depends on the surface elements involved. Hydrogen atoms sharing their electron with the metal atoms at the surface are then in the chemisorbed state (EChem » 50 kJ·mol-1H2). The chemisorbed hydrogen atoms may have a high surface mobility, interact with each other and form surface phases at sufficiently high coverage. In the next step the chemisorbed hydrogen atom can jump in the subsurface layer and finally diffuse on the interstitial sites through the host metal lattice. The hydrogen atoms contribute with their electron to the band structure of the metal.
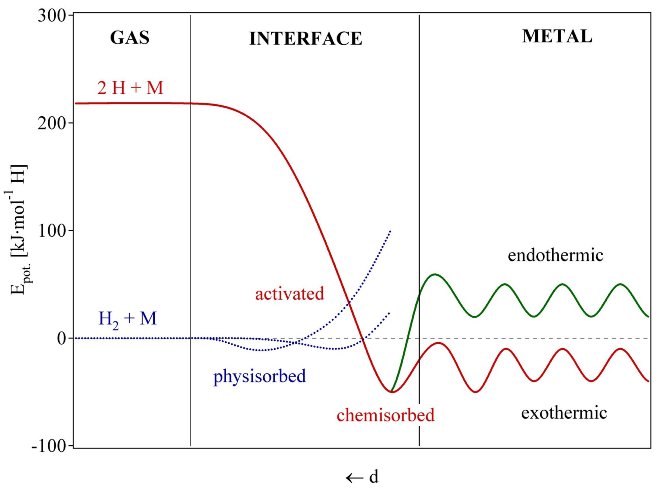
Fig. 6 Lennard-Jones potential [47] of hydrogen approaching a metallic surface. Far from the metal surface the potential of a hydrogen molecule and of 2 hydrogen atoms are separated by the dissociation energy The first attractive interaction of the hydrogen molecule is the Van der Waals force leading to the physisorbed state. Closer to the surface the hydrogen has to overcome an activation barrier for dissociation and formation of the hydrogen metal bond. Hydrogen atoms sharing their electron with the metal atoms at the surface are then in the chemisorbed state. In the next step the chemisorbed hydrogen atom can jump in the subsurface layer and finally diffuse on the interstitial sites through the host metal lattice [48].
The interaction of the hydrogen molecule with the surface atoms of a metal is described by means of electron coupling.
The hydrogen is at small hydrogen to metal ratio (H/M < 0.1) exothermically dissolved (solid-solution, a-phase) in the metal. The metal lattice expands proportional to the hydrogen concentration by approximately 2 to 3Å3 per hydrogen atom [49]. At greater hydrogen concentrations in the host metal (H/M > 0.1) a strong H-H interaction due to the lattice expansion becomes important and the hydride phase (b-phase) nucleates and grows. The hydrogen concentration in the hydride phase is often found to be H/M = 1. The volume expansion between the coexisting a- and the b-phase corresponds in many cases 10 to 20% of the metal lattice. Therefore, at the phase boundary large stress is built up and often leads to a decrepitation of brittle host metals such as intermetallic compounds. The final hydride is a powder with a typical particle size of 10 to 100 µm.

Fig. 7 Pressure composition isothermes for the hydrogen absorption in a typical intermetallic compound on the left hand side. The solid solution (a-phase), the hydride phase (b-phase) and the region of the coexistence of the two phases. The coexistange region is characterized by the flat plateau and ends at the critical temperature Tc. The construction of the Van’t Hoff plot is shown on the right hand side. The slope of the line is equal to the enthalpy of formation divided by the gas constant and the interception is equal to the entropy of formation divided by the gas constant.
The thermodynamic aspects of the hydride formation from gaseous hydrogen is described by means of pressure-composition isotherms (Fig. 12). While the solid solution and hydride phase coexists, the isotherms show a flat plateau, the length of which determines the amount of H2 stored. In the pure b-phase, the H2 pressure rises steeply with the concentration. The two-phase region ends in a critical point TC, above which the transition from a- to b-phase is continuous. The equilibrium pressure peq as a function of temperature is related to the changes DH and DS of enthalpy and entropy, respectively, by the Van’t Hoff equation:
 (Eq. 6)
As the entropy change corresponds mostly to the change from molecular hydrogen gas to dissolved solid hydrogen, it amounts approximately to the standard entropy of hydrogen (S0 = 130 J·K-1mol-1) and is therefore, DSf » -130 J·K-1mol-1H2 for all metal-hydrogen systems. The enthalpy term characterizes the stability of the metal hydrogen bond. To reach an equilibrium pressure of 1 bar at 300K ΔH should amount to 39.2 kJ mol-1H2. The entropy of formation term of metal hydrides leads to a significant heat evolution DQ = T·DS (exothermal reaction) during the hydrogen absorption. The same heat has to be provided to the metal hydride to desorb the hydrogen (entothermal reaction). If the hydrogen desorbs below room temperature this heat can be delivered by the environment. However, if the desorption is carried out above room temperature the necessary heat has to be delivered at the necessary temperature from an external source which may be the combustion of the hydrogen. For a stable hydride like MgH2 the heat necessary for the desorption of hydrogen at 300°C and 1 bar is approximately 25% of the higher heating value of hydrogen.
Several empirical models allow the estimation of the stability and the concentration of hydrogen in an intermetallic hydride. The maximum amount of hydrogen in the hydride phase is given by the number of interstitial sites in the intermetallic compound for which to following two criteria apply. The distance between two hydrogen atoms on interstitial sites is at least 2.1Å [50] and the radius of the largest sphere on an interstitial site touching all the neighboring metallic atoms is at least 0.37Å (Westlake criterion) [51]. The theoretical maximum volumetric density of hydrogen in a metal hydride, assuming a closed packing of the hydrogen, is therefore 253 kg·m-3, which is 3.6 times the density of liquid hydrogen. As a general rule it can be stated, that all elements with an electronegativity in the range of 1.35 to 1.82 do not form stable hydrides [46]. Exeptions are Vanadium (1.45) and Chromium (1.56), which form hydrides and Molybdenum (1.30) and Technetium (1.36) where hydride formation would be expected. The adsorption enthalpy can be estimated from the local environment of the hydrogen atom on the interstitial site. According to the rule of imaginary binary hydrides the stability of a hydrogen on an interstitial site is the weighted average of the stability of the corresponding binary hydrides of the neighboring metallic atoms [52]. More general is the rule of reversed stability (Miedema model): The more stable a intermetallic compound the less stable is the corresponding hydride and the other way around [53]. This model is based on the fact that hydrogen can only participate on a bond with a neighboring metal atom if the bonds between the metal atoms are at least partially broken.

Fig. 8 The local band-structure model. The heat of formation of binary hydrides MHx is related linearly to the characteristic band energy parameter DE = EF –Es, where EF is the Fermi energy and Es the center of the host metal electronic band with a strong s character at the interstitial sites occupied by hydrogen. For most metals Es can be taken as the energy which corresponds to one electron per atom on the integrated density-of-states curve [54].
Hydrogen absorption is electronically an incorporation of electrons and protons into the electronic structure of the host lattice. The electrons have to fill empty states at the Fermi energy EF while the protons lead to the hydrogen induced s-band approximately 4eV below the EF (fig. 13) The heat of formation of binary hydrides MHx is related linearly to the characteristic band energy parameter DE = EF –Es, where EF is the Fermi energy and Es the center of the host metal electronic band with a strong s character at the interstitial sites occupied by hydrogen. For most metals Es can be taken as the energy which corresponds to one electron per atom on the integrated density-of-states curve [54]. The semi empirical models mentioned above allow an estimation of the stability of binary hydrides as long as the rigid band theory can be applied. However, the interaction of hydrogen with the electronic structure of the host metal in some binary hydrides and especially in the ternary hydrides is often more complicated. In many cases the crystal structure of the host metal and therefore, also the electronic structure changes upon the phase transition and the theoretical calculation of the stability of the hydride becomes very complicated if not impossible.
The stability of metal hydrides is usually presented in the form of Van’t Hoff plots according to equation 6 (Fig. 14). The most stable binary hydrides have enthalpies of formation of DHf = -226 kJ·mol-1H2 e.g. HoH2. The least stable hydrides are FeH0.5, NiH0.5 and MoH0.5 with enthalpies of formation of DHf = +20 kJ·mol-1H2, DHf = +20 kJ·mol-1H2, and DHf = +92 kJ·mol-1H2, respectively [55]. Due to the phase transition upon hydrogen absorption, metal hydrides have the very useful property of absorbing large amounts of hydrogen at a constant pressure, i.e. the pressure does not increase with the amount of hydrogen absorbed as long as the phase transition takes place. The characteristics of the hydrogen absorption and desorption can be tailored by partial substitution of the constituent elements in the host lattice. Some metal hydrides absorb and desorb hydrogen at ambient temperature and close to atmospheric pressure. Several families of intermetallic compounds listed in table 2 are interesting for hydrogen storage. They all consist of an element with a high affinity to hydrogen, the A-element, and an element with a low affinity to hydrogen, the B-element. The latter is often at least partially nickel, since nickel is an excellent catalyst for the hydrogen dissociation.
One of the most interesting features of the metallic hydrides is the extremely high volumetric density of the hydrogen atoms present in the host lattice. The highest volumetric hydrogen density know today is 150 kg·m-3 found in Mg2FeH6 and Al(BH4)3. Both hydrides belong to the complex hydrides and will be discussed in the next chapter. Metallic hydrides reach a volumetric hydrogen density of 115 kg·m-3 e.g. LaNi5. Most metallic hydrides absorb hydrogen up to a hydrogen to metal ratio of H/M = 2. Greater ratios up to H/M = 4.5 e.g. BaReH9, [56] have been found, however all hydrides with a hydrogen to metal ratio of more than 2 are ionic or covalent compounds and belong to the complex hydrides.
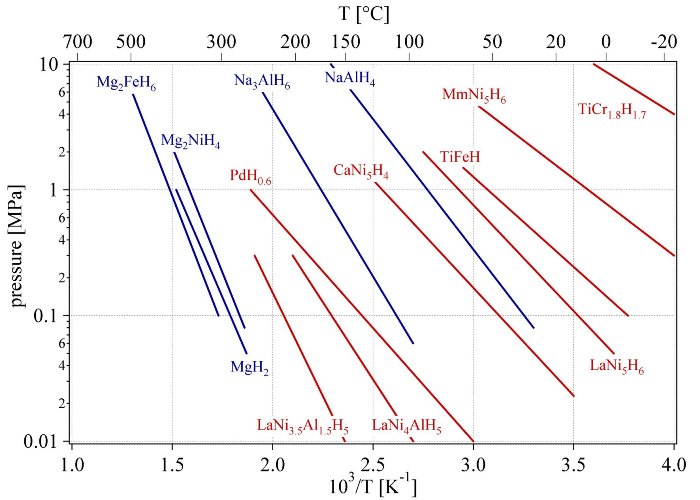
Fig. 9 Van’t Hoff plots of some selected hydrides. The stabilisation of the hydride of LaNi5 by the partial substitution of nickel with aluminum in LaNi5 is shown as well as the substitution of lanthanum with mischmetal (e.g. 51% La, 33% Ce, 12% Nd, 4% Pr).
Metal hydrides are very effective to store large amounts of hydrogen in a safe and compact way. All the reversible hydrides working around ambient temperature and atmospheric pressure consist of transition metals; therefore the gravimetric hydrogen density is limited to less than 3 mass%. It is still a challenge to explore the properties of the light weight metal hydrides.
5. Complex hydrides
The group one two and three light elements, e.g. Li, Mg, B, Al, build a large variety of metal-hydrogen complexes. They are especially interesting because of their light weight and the number of hydrogen atoms per metal atom which is in many cases 2. The main difference of the complex hydrides to the above described metallic hydrides is the transition to an ionic or covalent compound of the metals upon hydrogen absorption. The hydrogen in the complex hydrides is often located in the corners of a tetraheder with boron or aluminum in the center. The negative charge of the anion, [BH4]– and [AlH4]– is compensated by a cation e.g. Li or Na. The hydride complexes of borane, the tetrahydroborates M(BH4), and of alane the tetrahydroaluminate M(AlH4) are interesting storage materials, however, they were known to be stable and decompose only at elevated temperatures and often above the melting point of the complex.
Bogdanović and Swickardi [57] presented in 1996 for the first time adsorption and desorption pressure-concentration isotherms of catalyzed NaAlH4 at temperature of 180°C and 210°C. The isotherms exhibit an absence of hysteresis and a nearly horizontal pressure plateau. Furthermore, the catalyzed system reversibly absorbed and desorbed hydrogen up to 4.2 mass% and the mechanism of the two step reaction was described. A more detailed study of the NaAlH4 with an improved catalyst was published in 2000 by Bogdanović et al. [58]. A desorption hydrogen pressure of 2 bar at 60°C was found and the enthalpy for the dissociation reaction was determined to be 37 kJ·mol-1 and 47 kJ·mol-1 for the first dissociation step of Ti-doped NaAlH4: 3 NaAlH4 ® Na3AlH6 + 2 Al + 3 H2 (3.7 wt% H) and the second Na3AlH6 ® 3NaH + Al + 3/2 H2 (3.0 wt% H) , respectively. Therefore, the equilibrium hydrogen pressure at room temperature is approximately 1 bar. Furthermore, the reaction is reversible, a complete conversion to product was achieved at 270°C under 175 bar hydrogen pressure in 2-3 hours [59].
The first report of a pure alkali metal tetrahydroboride appeared in 1940 by Schlesinger and Brown [60] who synthesized the lithiumtetrahydroboride (lithiumborohydride) (LiBH4) by the reaction of ethyllithium with diborane (B2H6). The direct reaction of the corresponding metal with diborane in etheral solvents under suitable conditions produces high yields of the tetrahydroborides [61] 2 MH + B2H6 ® 2 MBH4 where M = Li, Na, K etc. Direct synthesis from the metal, boron and hydrogen at 550 – 700°C and 30 – 150 bar H2 has been reported to yield the lithium salt, and it has been claimed that such a method is generally applicable to groups IA and IIA metals [62]. The reaction involving either the metal or the metal hydride, or the metal together with triethylborane in an inert hydrocarbon has formed the basis of a patent M + B + 2H2 ® MBH4, where M = Li, Na, K etc.
The stability of metal tetrahydroborides has been discussed in relation to their percentage ionic character, and those compounds with less ionic character than diborane are expected to be highly unstable [63]. Steric effects have also been suggested to be important in some compounds [64, 65]. The special feature exhibited by the covalent metal hydroborides is that the hydroboride group is bonded to the metal atom by bridging hydrogen atoms similar to the bonding in diborane, which may be regarded as the simplest of the so called „electron-deficient“ molecules. Such molecules possess fewer electrons than those apparently required to fill all the bonding orbital’s, based on the criterion that a normal bonding orbital involving two atoms contains two electrons. The molecular orbital bonding scheme for diborane has been discussed extensively [65].
The compound with the highest gravimetric hydrogen density at room temperature known today is LiBH4 (18 mass%). Therefore, this complex hydride could be the ideal hydrogen storage material for mobile applications. LiBH4 desorbs three of the four hydrogen in the compound upon melting at 280°C and decomposes into LiH and boron. The desorption process can be catalyzed by adding SiO2 and significant thermal desorption was observed starting at 100°C [66]. Recently it has been shown, that the hydrogen desorption reaction is reversible and the end products lithimhydride and boron absorb hydrogen at 690°C and 200 bar to form LiBH4 [67]. The scientific understanding of the mechanism of the thermal hydrogen desorption from LiBH4 and the absorption remains a challenge and more research work has to be carried out. Very little is known today about Al(BH4)3 a complex hydride with a very high gravimetric hydrogen density of 17 mass% and the highest known volumetric hydrogen density of 150 kg·m-3. Furthermore, Al(BH4)3 has a melting point of –65°C and is liquid at room temperature. Beside of the the covalent hydrocarbons, this is the only liquid hydride at room temperature.
6. Reaction of Metals with Water
Hydrogen can be generated from metals and chemical compounds reacting with water. The common experiment -shown in many chemistry classes – where a piece of sodium floating on water produces hydrogen, demonstrates such a process. The sodium is transformed to sodium hydroxide in this reaction. The reaction is not directly reversible but the sodium hydroxide could later be removed and reduced in a solar furnace back to metallic sodium. Two sodium atoms react with two water molecules and produces one hydrogen molecule. The hydrogen molecule produces again a water molecule in the combustion, which can be recycled to generate more hydrogen gas. However, the second water molecule necessary for the oxidation of the two sodium atoms has to be added. Therefore, sodium has a gravimetric hydrogen density of 3 mass%. The same process carried out with lithium leads to a gravimetric hydrogen density of 6.3 mass%. The major challenge with this storage method is the reversibility and the control of the thermal reduction process in order to produce the metal in a solar furnace. The process has been successfully demonstrated with zinc [68]. The first, endothermic step is the thermal dissociation of ZnO(s) into Zn(g) and O2 at 2300 K using concentrated solar energy as the source of process heat. The second, non-solar, exothermic step is the hydrolysis of Zn(l) at 700 K to form H2 and ZnO(s); the latter separates naturally and is recycled to the first step. Hydrogen and oxygen are derived in different steps, thereby eliminating the need for high-temperature gas separation. A second-law analysis performed on the closed cyclic process indicates a maximum exergy conversion effciency of 29% (ratio of DG (H2 + 0.5 O2 ® H2O) for the H2 produced to the solar power input), when using a solar cavity-receiver operated at 2300 K and subjected to a solar flux concentration ratio of 5000. The major sources of irreversibility are associated with the re-radiation losses from the solar reactor and the quenching of Zn(g) and O2 to avoid their recombination. An economic assessment for a large-scale chemical plant, having a solar thermal power input into the solar reactor of 90 MW and a hydrogen production output from the hydrolyser of 61 GWh/year, indicates that the cost of solar hydrogen ranges between 0.13 and 0.15$/kWh (based on its low heating value and a heliostat feld cost at 100-150$/ m2 ) and, thus, might be competitive vis-à-vis other renewables-based routes such as electrolysis of water using solar-generated electricity. The economic feasibility of the proposed solar process is strongly dependent on the development of an effective Zn/O2 separation technique (either by quench or by in situ electrolytic separation) that eliminates the need for an inert gas.
7.Conclusion
The hydrogen revolution following the industrial age has just started. Hydrogen production, storage and conversion has reached a technological level although plenty of improvements and new discoveries are still possible. The hydrogen storage is often considered as the bottleneck of the renewable energy economy based on the synthetic fuel hydrogen. Six different hydrogen storage methods have been described. Among the well established high pressure cylinders for laboratory applications and the liquid hydrogen for air and space applications, metal hydrides and complex hydrides offer a very safe and efficient way to store hydrogen (fig. 10). Further scientific research and technical developments will lead to new materials with a higher volumetric and gravimetric hydrogen density. The best materials today show a volumetric storage density of 150 kg·m-3 which can be improved by approximately 50% according to theoretical estimations. General and reliable theoretical models for the stability of the hydrides are still missing and have to be developed.
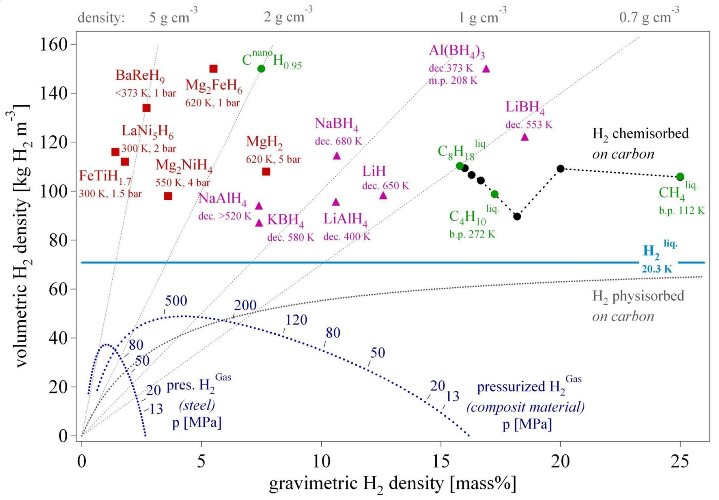
Fig. 10 Volumetric and gravimetric hydrogen density of some selected hydrides. Mg2FeH6 shows the highest known volumetric hydrogen density of 150 kg·m-3, which is more than the double of liquid hydrogen. BaReH9 has the largest H/M ratio of 4.5, i.e. 4.5 hydrogen atoms per metal atom. LiBH4 exhibits the highest gravimetric hydrogen density of 18 mass%. Pressurized gas storage is shown for steel (tensile strength sv = 460 MPa, density 6500 kg·m-3) and a hypothetical composite material (sv = 1500 MPa, density 3000 kg·m-3).
8. References
[7] Handbook of Chemistry and Physics, Weast R. C., ed. 57th (1976), CRC Press
[8] Steinfeld A., Palumbo R., „Solar Thermochemical Process Technology“, Encyclopedia of Physical Science and Technology, R. A. Meyers Ed., Academic Press 15 (2001), pp. 237-256, ISBN 0-12-227410-5.
[9] Product specification from GTec SA, rte de Clos-Donroux 1, CH-1870 Monthey, Switzerland.
[10] W. B. Leung, N. H. March and H. Motz, Physics Letters 56A (6) (1976), pp. 425-426
[11] Huston, E.L., „ALiquid and Solid Storage of Hydrogen.“ Proceedings of the 5th World Hydrogen Energy Conference. Vol. 3; July 15-20, 1984, Toronto, Canada
[12] Flynn, T.M., „A Liquification of Gases.“ McGraw-Hill Encyclopedia of Science &Technology. 7th edition. Vol. 10. New York: McGraw-Hill; (1992).pp. 106-109.
[13] Gary Chen and Samim Anghaie based on NASA/NIST databases, http://www.inspi.ufl.edu/data/h_prop_package.html
[14] M. von Ardenne, G. Musiol, S. Reball, „Effekte der Physik“, Verlag Harry Deutsch (1990), pp. 712-715
[15] F. London, Z. Physik. 63 (1930), pp. 245; Z. Physik. Chem. 11 (1930), pp. 222
[16] S. Brunauer, P.H. Emmett and E. Teller, J. Amer. Chem. Soc. 60 (1938), pp. 309.
[17] A.C. Dillon, K.M. Jones, T.A. Bekkedahl, C.H. Kiang, D.S. Bethune, and M.J. Heben, Nature 386 (1997), p. 377.
[18] A. C. Dillon et al. Proceedings of the 2000 DOE/NREL hydrogen program review, May 8-10, (2000)
[19] M. Hirscher, M. Becher, M. Haluska, U. Dettlaff-Weglikowska, A. Quintel, G.S. Duesberg, Y.M. Choi, P. Downes, M. Hulman, S. Roth, I. Stepanek, P. Bernier, Applied Physics A 72 (2001), p. 129.
[20] S. J. Gregg and K. S. W. Sing, „Adsorption, Surface Area and Porosity“, Academic Press (1967), London and New York
[21] G. Stan and M. W. Cole, Low Temperature Physics 100 (1998), p. 539.
[22] M. Rzepka, P. Lamp, and M.A. de la Casa-Lillo, J. of Physical Chemistry B102 (1998), p. 10849.
[23] K. A. Williams and P. C. Eklund, Chemical Physics Letters 320 (2000), p. 352.
[24] S.M. Lee, K.H. An, Y.H. Lee, G. Seifert, T. Frauenheim, J. Korean Phys. Soc. 38 (2001), p. 686; S.M. Lee and Y.H. Lee, Appl. Phys. Lett. 76 (2000), p. 2879.
[25] Y. Ma, Y. Xia, M. Zhao, R. Wang, and L. Mei, Phys. Rev. B 63 (2001), p. 115422.
[26] W. B. Leung and N. H. March, and H. Motz, Physics Letters 56 (1976), p. 425.
[27] R.A. Beebe, J. Biscoe, W.R. Smith, and C.B. Wendell, J. Am. Chem. Soc. 69 (1947), p. 95.
[28] A. Züttel, P. Sudan, Ph. Mauron, T. Kyiobaiashi, Ch. Emmenegger, and L. Schlapbach, Int. J. of Hydrogen Energy 27 (2002), p. 203.
[29] Y. Ye, C.C. Ahn, C. Witham, B. Fultz, J. Liu, A.G. Rinzler, D. Colbert, K.A. Smith, and R.E. Smalley, Applied Physics Letters 74 (1999), p. 2307.
[30] C. Liu, Y.Y. Fan, M. Liu, H.T. Cong, H.M. Cheng, M.S. Dresselhaus, Science, 286 (1999), p. 1127.
[31] Y.Y. Fan, B. Liao, M. Liu, Y.L. Wei, M.Q. Lu, and H.M. Cheng, Carbon, 37 (1999), p. 1649.
[32] P. Chen, X. Wu, J. Lin, and K.L. Tan, Science 285 (1999), p. 91.
[33] M. Hirscher, M. Becher, M. Haluska, A. Quintel, V. Skakalova, Y.M. Choi, U. Dettlaff-Weglikowska, S. Roth, I. Stepanek, P. Bernier, A. Leonhardt, and J. Fink, J. of Alloys and Compounds 330-332 (2002), p. 654.
[34] R. Ströbel, L. Jörissen, T. Schliermann, V. Trapp, W. Schütz, K. Bohmhammel, G. Wolf, and J. Garche, J. of Power Sources 84 (1999), p. 221.
[35] M.G. Nijkamp, J.E.M.J. Raaymakers, A.J. van Dillen, and K.P. de Jong, Appl. Phys. A 72 (2001), p. 619.
[36] Ch. Nützenadel, A. Züttel, and L. Schlapbach, Chap. 9 „Electronic Properties of Novel Materials“, Science and Technologyof Molecular Nanostructures, eds. H. Kuzmany, J. Fink, M. Mehring, and S. Roth, American Institute of Physics, New York (1999), p. 462
[37] Ch. Nützenadel, A. Züttel, Ch. Emmenegger, P. Sudan, and L. Schlapbach, Chap. 10 „Sciences and Applications of Nanotubes“, Kluwer Academic Publishing / Plenum Press, „Fundamental Materials Research Series“, Ed. M. F. Thorpe, p. 205
[38] A. Züttel, P. Sudan, Ph. Mauron, Ch. Emmenegger, T. Kiyobayashi, and L. Schlapbach, J. of Metastable and Nanocrystalline Materials 11 (2001) p. 95.
[39] S.M. Lee, K.S. Park, Y.C. Choi, Y.S. Park, J.M. Bok, D.J. Bae, K.S. Nahm, Y.G. Choi, S.Ch. Yu, N. Kim, T. Frauenheim, and Y.H. Lee, Synthetic Metals 113 (2000), p. 209.
[40] Weitkamp J; Fritz M; Ernst S, International J. of Hydrogen Energy, Vol. 20, Nr. 12 (1995), pp. 967-970
[41] Langmi H W; Walton A; Al-Mamouri M M; Johnson S R, Book D; Speight J D; Edwards P P; Gameson I; Anderson P A; Harris I R, J. of Alloys and Compounds 356-357 (2003), pp. 710-715
[42] N. L. Rosi, J. Eckert, M. Eddaoudi, D. T. Vodak, J. Kim, M. O’Keeffe, O. M. Yaghi, Science 300 (2003), pp. 1127-1129.
[43] G. R. Pearson, Chem. Rev. 85 (1985) 41-49.
[44] Huheey, J.E. Inorganic Chemistry (1983); Harper & Row, New York
[45] W. M. Mueller, I. R. Blackledge, G. G. Libowitz (eds.): Metal Hydrides, Academic Press, New York (1968)
[46] Peter Rittmeyer, Ulrich Wietelmann, „Chap.: Hydrides“, Ullmann’s Encyclopedia of Industrial Chemistry, Fifth, Completely Revised Edition, Volume A13, VCH, pp. 199-226
[47] J. E. Lennard-Jones, Trans. Faraday Soc. 28 (1932), pp. 333
[48] L. Schlapbach, „chap 2 : „Surface Properties and Activation““, Hydrogen in Intermetallics Compounds II, L. Schlapbach (ed), Springer, Topics in Applied Physics, Vol. 67 (1992), pp. 15-95.
[49] Y. Fukai, Z. Phys. Chem. 164 (1989), pp. 165
[50] A. C. Switendick, Z. Phys. Chem. N.F. 117 (1979), pp. 89
[51] D.J. Westlake, J. Less-Common Metals 91 (1983), pp.275-292
[52] A. R. Miedema, J. Less-Common Met 32 (1973), pp. 117
[53] H. H. Van Mal, K.H.J. Buschow and A.R. Miedema, J. Less-Common Met. 35 (1974), pp. 65
[54] R. Griessen and A. Driessen, Phys. Rev. B 30:8 (1984), pp. 4372-4381
[55] R. Griessen and T. Riesterer, „Heat of Formation Models“ in „Hydrogen in Intermetallic Compounds I Electronic, Thermodynamic, and Crystallographic Properties, Preparation“, L. Schlapbach, ed., Springer Series Topics in Applied Physics, Vol. 63 (1988), pp. 219-284.
[56] Klaus Yvon, „Complex Transition Metal Hydrides „, Chimia 52:10 (1998), pp. 613-619
[57] B. Bogdanovic, M. Schwickardi, J. Alloys Comp. 253-254 (1997), pp. 1-9
[58] B. Bogdanovic, R.A. Brand, A. Marjanovic, M. Schwickardi, J. Tolle, J. of Alloys and Compounds, 2000, Vol 302, Iss 1-2, pp 36-58
[59] T. N. Dymova, N.G. Eliseeva, S. I. Bakum, Y. M. Dergachev, Dok. Akad. Nauk USSR 215 (1974), pp. 1369
[60] H. J. Schlesinger and H. C. Brown, J. American Chemical Society 62 (1940), pp. 3429-3435.
[61] H. J. Schlesinger, H. C. Brown, H. R. Hoekstra, L. R. Rapp, J. of the American Chemical Society 75 (5 JAN 1953), pp. 199-204
[62] D. Goerrig, Ger. Pat. 1,077,644 (Dec. 27, 1958)
[63] G. N. Schrauzer, Naturwissenschaften 42 (1955), pp. 438
[64] S. J. Lippard and D. A. Ucko, Inorg. Chem. 7 (1968), pp. 1051
[65] W. N. Lipscomb, Boron Hydrides, Benjamin, New York (1963)
[66] Züttel A; Wenger P; Rensch S; Sudan P; Mauron P; Emmenegger C, J. of Power Sources 5194 (2003), pp.1-7
[67] P. Sudan, A. Züttel…Letter to Nature (2003), submitted
[68] A.Steinfeld, International J. of Hydrogen Energy 27 (2002), pp. 611 –619